Friday, August 23, 2024

Autoencoder using Python

What is an Autoencoder?

An Autoencoder is a type of artificial neural network used to learn efficient codings of data. The aim is to learn a representation (encoding) for a set of data, typically for the purpose of dimensionality reduction. The network consists of two main parts:

  1. Encoder: This part compresses the input data into a latent-space representation (a smaller dimensional space).
  2. Decoder: This part reconstructs the input data from the compressed latent-space representation.

Autoencoders are trained to minimize the difference between the input and output, which encourages the model to learn an efficient representation of the data. Because autoencoders are unsupervised, they don't require labeled data.
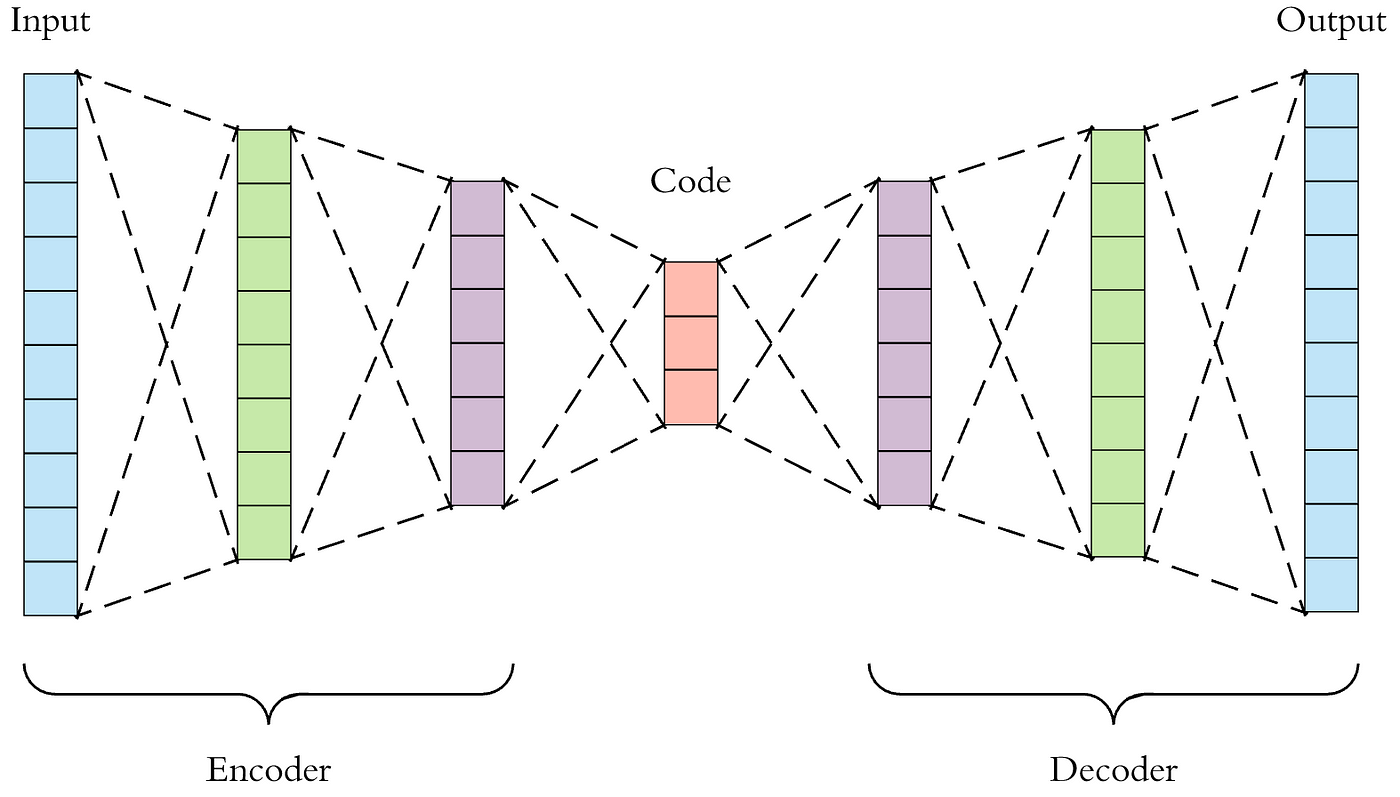
https://miro.medium.com/v2/resize:fit:1400/1*44eDEuZBEsmG_TCAKRI3Kw@2x.png

Anomaly Detection using Autoencoder

Anomaly detection involves identifying data points that don't fit the expected pattern. In the context of autoencoders, anomalies are identified based on the reconstruction error. If the reconstruction error (the difference between the input and the output) is higher than a certain threshold, the data point is considered an anomaly.

Python Code for Anomaly Detection using Autoencoder

Here’s how you can implement a simple autoencoder for anomaly detection:

import numpy as np
import pandas as pd
from tensorflow.keras.models import Model
from tensorflow.keras.layers import Input, Dense
from sklearn.preprocessing import MinMaxScaler
from sklearn.model_selection import train_test_split
from sklearn.metrics import mean_squared_error
import matplotlib.pyplot as plt

# Step 1: Generate synthetic data
data = np.random.normal(0, 1, (1000, 20))

# Introduce anomalies
anomalies = np.random.normal(0, 5, (50, 20))
data_with_anomalies = np.vstack([data, anomalies])

# Step 2: Normalize the data
scaler = MinMaxScaler()
data_scaled = scaler.fit_transform(data_with_anomalies)

# Step 3: Split the data into training and testing sets
X_train, X_test = train_test_split(data_scaled, test_size=0.2, random_state=42)

# Step 4: Build the Autoencoder Model
input_layer = Input(shape=(X_train.shape[1],))

# Encoder
encoded = Dense(16, activation='relu')(input_layer)
encoded = Dense(8, activation='relu')(encoded)
encoded = Dense(4, activation='relu')(encoded)

# Decoder
decoded = Dense(8, activation='relu')(encoded)
decoded = Dense(16, activation='relu')(decoded)
decoded = Dense(X_train.shape[1], activation='sigmoid')(decoded)

# Autoencoder Model
autoencoder = Model(inputs=input_layer, outputs=decoded)
autoencoder.compile(optimizer='adam', loss='mse')

# Step 5: Train the Autoencoder
history = autoencoder.fit(X_train, X_train,
                          epochs=50,
                          batch_size=32,
                          validation_split=0.1,
                          shuffle=True)

# Step 6: Predict and Evaluate Anomalies
X_test_pred = autoencoder.predict(X_test)

# Calculate the Mean Squared Error (MSE)
mse = mean_squared_error(X_test, X_test_pred, multioutput='raw_values')

# Define a threshold for anomaly detection
threshold = np.percentile(mse, 95)

# Identify anomalies
anomalies = mse > threshold
print(f"Number of anomalies detected: {np.sum(anomalies)}")

# Step 7: Visualize Results
plt.figure(figsize=(10, 5))

# Plot the loss over epochs
plt.subplot(1, 2, 1)
plt.plot(history.history['loss'], label='Training Loss')
plt.plot(history.history['val_loss'], label='Validation Loss')
plt.legend()
plt.title('Training and Validation Loss')

# Plot MSE histogram
plt.subplot(1, 2, 2)
plt.hist(mse, bins=50)
plt.axvline(threshold, color='red', linestyle='--')
plt.title('MSE Histogram with Threshold')

plt.show()


Explanation:

  1. Data Generation: Synthetic data is generated with normal distribution. Some anomalies are introduced with higher variance.

  2. Data Normalization: The data is normalized using MinMaxScaler.

  3. Autoencoder Model: The autoencoder is built with a three-layer encoder and decoder. The model is compiled using the Adam optimizer and MSE loss.

  4. Training: The autoencoder is trained to reconstruct the input data.

  5. Anomaly Detection: After training, the model's reconstruction error is calculated for the test set. A threshold is set (95th percentile), and data points with higher errors are flagged as anomalies.

  6. Visualization: Loss curves and MSE histogram are plotted to visualize the training process and the threshold for anomaly detection.

Sunday, August 18, 2024

Types of mean in statistics

In statistics, several types of means are used to summarize data, each with its own significance and use cases. The most common types include:

  1. Arithmetic Mean
  2. Geometric Mean
  3. Harmonic Mean
  4. Weighted Mean

Let's explore each of these means and see how they can be computed using Python.

Types of Mean ins statistics

1. Arithmetic Mean

The arithmetic mean is the most common type of mean, often referred to simply as the "average." It is calculated by summing all the values and dividing by the number of values.

Formula:

Arithmetic Mean=i=1nxin\text{Arithmetic Mean} = \frac{\sum_{i=1}^{n} x_i}{n}

Python Example:

import numpy as np

data = [10, 20, 30, 40, 50]
arithmetic_mean = np.mean(data)
print(f"Arithmetic Mean: {arithmetic_mean}")


2. Geometric Mean

The geometric mean is useful when dealing with data that involves multiplication or percentages, such as growth rates. It is calculated by multiplying all the values together and then taking the nth root, where n is the number of values.

Formula:

Geometric Mean=(i=1nxi)1n\text{Geometric Mean} = \left( \prod_{i=1}^{n} x_i \right)^{\frac{1}{n}}

Python Example:

from scipy.stats import gmean

data = [10, 20, 30, 40, 50]
geometric_mean = gmean(data)
print(f"Geometric Mean: {geometric_mean}")


3. Harmonic Mean

The harmonic mean is useful when dealing with rates or ratios, such as speed or density. It is calculated as the reciprocal of the arithmetic mean of the reciprocals of the data values.

Formula:

Harmonic Mean=ni=1n1xi\text{Harmonic Mean} = \frac{n}{\sum_{i=1}^{n} \frac{1}{x_i}}

Python Example:

from scipy.stats import hmean

data = [10, 20, 30, 40, 50]
harmonic_mean = hmean(data)
print(f"Harmonic Mean: {harmonic_mean}")


4. Weighted Mean

The weighted mean is an average that takes into account the relative importance (weight) of each value. It is useful when different data points contribute differently to the overall mean.

Formula:

Weighted Mean=i=1nwixii=1nwi\text{Weighted Mean} = \frac{\sum_{i=1}^{n} w_i \cdot x_i}{\sum_{i=1}^{n} w_i}

Where wiw_i is the weight for each value xix_i.

Python Example:

data = [10, 20, 30, 40, 50]
weights = [1, 2, 3, 4, 5]  # Weights corresponding to each data point
weighted_mean = np.average(data, weights=weights)
print(f"Weighted Mean: {weighted_mean}")


Summary of Outputs:

  • Arithmetic Mean: 30.0
  • Geometric Mean: Approximately 26.379
  • Harmonic Mean: Approximately 21.818
  • Weighted Mean: 40.0

Explanation:

  • Arithmetic Mean is a simple average and is widely used for data where each observation is equally important.
  • Geometric Mean is more appropriate for data that involves products, such as growth rates.
  • Harmonic Mean is particularly useful for average rates, such as speed or density.
  • Weighted Mean adjusts the mean by giving different importance to different data points, useful in scenarios where some data points have more significance than others.

What is Axiomatic probability?

Axiomatic probability is a formal approach to probability theory that is based on a set of axioms or rules. These axioms, introduced by the Russian mathematician Andrey Kolmogorov in 1933, form the foundation of modern probability theory. 

Andrey Nikolayevich Kolmogorov | Russian Mathematician & Probability Theory  Pioneer | Britannica

The three main axioms are:

  1. Non-negativity: For any event AA, the probability of AA is a non-negative number.

    P(A)0P(A) \geq 0
  2. Normalization: The probability of the entire sample space SS is 1.

    P(S)=1P(S) = 1
  3. Additivity: For any two mutually exclusive (disjoint) events AA and BB, the probability of their union is equal to the sum of their probabilities.

    P(AB)=P(A)+P(B)if AB=P(A \cup B) = P(A) + P(B) \quad \text{if } A \cap B = \emptyset

Python Example:

Let's implement a simple example in Python to demonstrate these axioms.

# Define the sample space
S = {"H", "T"}  # Let's say we have a simple coin toss scenario: Heads (H) or Tails (T)

# Define a probability function that satisfies the axioms
def probability(event):
    event_space = {"H": 0.5, "T": 0.5}  # Assign probabilities to each outcome
    return sum(event_space[e] for e in event)

# Axiom 1: Non-negativity
A = {"H"}
print(f"P(A): {probability(A)} >= 0")  # Output should be non-negative

# Axiom 2: Normalization
B = {"H", "T"}
print(f"P(S): {probability(B)} == 1")  # The probability of the entire sample space should be 1

# Axiom 3: Additivity
C = {"H"}
D = {"T"}
print(f"P(C ∪ D): {probability(C.union(D))} == P(C) + P(D): {probability(C) + probability(D)}")
# The sum of P(C) and P(D) should equal P(C ∪ D) because C and D are disjoint (mutually exclusive)
 

Explanation:

  • Non-negativity: The probability of event AA (e.g., getting a Head) is defined as 0.5, which is non-negative.

  • Normalization: The probability of the entire sample space SS (e.g., either getting a Head or a Tail) is calculated as 1, satisfying the normalization axiom.

  • Additivity: Since getting a Head (C) and getting a Tail (D) are mutually exclusive events, the probability of getting either a Head or a Tail (C ∪ D) is the sum of their individual probabilities.

    Output:

    Running the above code will produce:

    P(A): 0.5 >= 0
    P(S): 1 == 1
    P(C ∪ D): 1.0 == P(C) + P(D): 1.0